City Information Help
City Information
City Information shows statistics about a selected urban area (village, town or city), and can be used to change the name of that urban area.
Each urban area has its own
Town Hall around which it grows. Transportation of passengers and mail helps growth, which involves: roads built or commandeered over by the
public service player; new city buildings and
industries appear; and city limits extend.
Click on a Town Hall in the main game window with the
Inspection Tool, or on an urban area listed in the
City List to open the
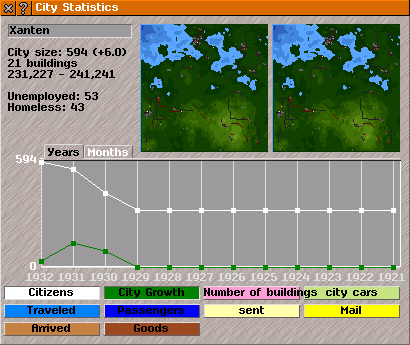
City Information window, which contains: (1) a name box; (2) statistics; (3) two mini-maps; and (4) statistics graphs for the urban area.
Name: the name of urban area appears in a name box at top of the
City Information window.
Names of urban areas are used in the default names of stops, but these can be changed later.
To change the urban area's name name: click on the name box and type in a new name.
Tip: Use
[!] to toggle view of name of urban area, above a Town Hall, in the main game window. See readme_citylist.html (in ...simutrans/text/) for help on name generation of urban areas.
Under the name box, statistics are provided for the urban area:
City size: the number of citizens (i.e., the population of the urban area). Any recent increase in population is shown in brackets.
Buildings: the number of buildings in the urban area.
Map co-ordinates: shows the city limits, which change as the urban area grows.
The following statistics show whether a city is fulfilling demand:
Unemployed: the more unemployed people that there are, the more demand for new commercial buildings (providing jobs) that there is.
Homeless: the more homeless people that there are (not necessarily living on the streets - living, perhaps, with friends, or in multiple occupation), the more demand that there is for housing.
Power demand: Shows the amount of
electricity currently demanded by this city.
Mini-maps of the game world in the
City Information window show the destinations of passengers and mail produced in the present urban area.
Destinations are shown by coloured dots for the current game calendar month (right mini-map) and the previous game calendar month (left mini-map). The colour of destination dots shows information about passengers and mail:
-
Dark yellow: passengers were able to walk the whole way to their destination.
-
Yellow: a suitable route was found, and the starting stop was not too crowded (equivalent to the happy face in the
stop window).
-
Terquoise: passengers reached the destination by means of their private cars.
-
Orange: there is no available route to the desired destination.
-
Purple: there is a route to the desired destination, but it takes too long for passengers to tolerate.
-
Red: a suitable route was found, but the starting stop was too crowded to be used (equivalent to the unhappy face in the
stop window).
Graph shows statistics for the urban area.
The y-axis is quantity, the x-axis time.
Click on a graph index tab to change scale of x-axis:
Years: shows annual values for last twelve game calendar years.
Months: shows monthly values for last twelve game months.
Click on a graph option button to see choose which information to display on graph (the button is indented when an option selected). Multiple graphs can be overlaid over each other.
Colours of lines on graph correspond to colours of graph-Option buttons:
Citizens: the population.
City growth: the change in population (dependent on city size, transport service provided for passengers and mail and goods delivered).
Travelled: passengers and mail from this urban area transported by public transport (shown as a
happy face in the stop information window).
Passengers: the total number of passengers and mail generated in this urban area.
Buildings: the total number of buildings in the urban area.
Traffic: the total number of journies made by passengers both
into and
out of this urban area, using
private cars instead of public transport.
Sent: the total amount of mail transported by public transport in this urban area.
Mail: the total amount of mail generated in this urban area.
Goods supplied: the total quantity of passengers and mail (measured in bags) arriving in this urban area by public transport.
Goods needed: the quantity of goods arriving in this urban area by public transport. Transporting goods to a city increases that city's growth.
Power supply: the amount of
electricity supplied to the city. This will not be higher than the demand.
Power demand: the amount of
electricity drawn by substations in the city. Note that this will be zero unless the city has at least one substation within the city limits, but the demand can be seen from the "power demand" number above the graph area.
Congestion: how congested that the roads of this urban area are with
private cars. The more congested the roads, the more that passengers will want to take public transport, and the less that the city will grow. Values of over 100 will stop the city growing entirely.
Car ownership: the percentage of people who have access to
private cars. This value changes over time, but is the same for every city.
Tip: Settings related to urban areas can be changed in simuconf.tab and cityrules.tab files, located in the /simutrans/config directory.